Back on my now inaccessible blog, I talked about the need for product managers to practice economic indifference. I used the mathematics of manifolds to show how decisions make at one level of a system can be independent to those made a another level. I say “can” here because the decisions made at subordinate levels need to be consistent with the constraints placed on them by those above them. But, there is a flip side. That being enablers provided by those above them. Economic indifference is one such enabler.
When I tell you to build me a car, you can build any car. I can’t come back and say, I want a truck. Nor, can I come back and say I want a red car. My specification error is my problem, not yours. I left you the freedom, and you took it. My bad. Actually, it’s my bad for now wanting something more specific than what I had specified. The granuality of my spec dictates what I will have to accept, or put in different terms the amount of economic indifference I have to accept. Or, from the perspective of the developer, the degrees of freedom I left them. And, Agilists want as many degrees of freedom that they can get.
That said, today I’ll use the mathematics of vectors, to talk about many things around product management.

The Basic Vector
A vector! What does a vector have to do with business? Well, strategy, vision, forecast, capabilities, processes, projects, competition, and ultimately economic indifference.
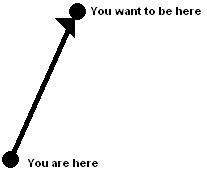
From Here to There
When we need to figure out where a shop is in the mall, or which bus to take, we look for a map, and hopefully, it has a You Are Here indicator. Then, we look for our objective. The map provides us with a convoluted path to take to get there. We could draw a vector on the map, an as the bird flies view, but it doesn’t help much on the ground. That vector would be representative of our economic indifference. The shops along the way might catch our attention, we might get sucked in, we might buy something, we might have to take that something to the car, or grab a bite to eat before we finally arrive at the pointy end of the vector, our destination. Why did I come here, we wonder. Ah, Saturday, and I’m not at work? What’s wrong with me, playing hooky. The team….
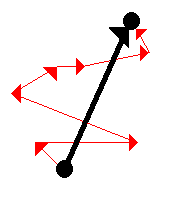
Getting There--How One Vector Summarizes a Bunch of Vectors
Our path around the mall is shown in red. We decompose our objective vector into a collection of vectors. That collection of vectors get us there. That collection of vectors is closer to actuals, or the reality, and a little less economically indifferent than our objective vector.

Decomposed Yet Again, More Vectors
Leaving our mall example behind, we have a business objective (black), and we have these capabilities, resources, and staff (red) to get us to the our goal. The goal incorporates the matter of time into the vector. We arrive at a time and place. But, one of the capabilities is just a plan. It’s realization shows up as another collection of vectors (blue.) The red vectors represent ongoing operational capabilities. The blue vectors represent a project that will put the process into operation. We don’t have that capability right now, so its a risk.
How did we determine our goal and draw the objective vector? We did our forecast.
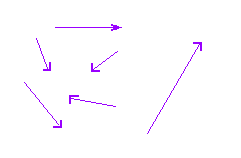
Forecast Factors as a Collection of Vectors
You build a forecast with metrics that show where you’ve been over time, and where you expect to be over time. It might be a set of rates. Each forecast factor heads off in its own direction.
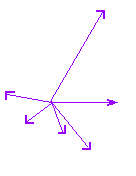
Vectors Collected, a Morpheme
We can bring move the vectors around, so that they all start at the same point. Oddly enough, it starts to look like a morpheme, the meaning consitutents of words. Just an aside.
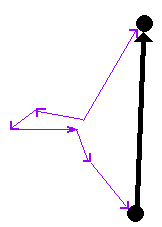
From Forecast Vectors to Strategy VectorHere I've added all the forecast vectors together to arrive at my strategy vector. I did not weight the forecast vectors. Strategy as an Organized Collection of Capabilities
Remember that the forecast variables were derived from time series data. A time series assumes that the policy basis and capabilitity basis haven’t changed. If they change, the old numbers become unreliable. When you build an estimation database, you end up creating an estimate based on averages. You are estimating your existing capabilities. The red vectors represent those capabilities. If our strategy was a real strategy, the red vectors would converge on the black vector not at the arrow, because you would divide the strategy into timeframes.
Strategies are supposed to be long-term propositions. Capabilities are created to support them. The capabilities persist for a long time. They may persist longer than the strategy that birthed them. Those capabilities improve over time. At the same time the capabilities become constraints on strategy.
Vision is not based on a forecast, or on a collection of capabilities. With a vision, you point off in a direction, and build the capabilities to get there. A product might be a strategy where it’s improvements would be linear, or in otherwords sustaining or continous. A product might be a vision where it’s improvements would be non-linear, radical, or discontinous. A vision departs strategy, and costs quite a bit more than doing the same old same old day in and day out.

Strategy (Yesterday) and Vision (Tomorrow)
Vision requires us to let go of the prior strategy and get with the new program. You might run into a vision when you get a new CEO. You will run into a vision if you ever face a market transition as described by Moore’s technology adoption lifecycle. It amounts to leaping into the new boat. The old boat is sinking. Well, maybe not yet, but its sinking is anticipated.
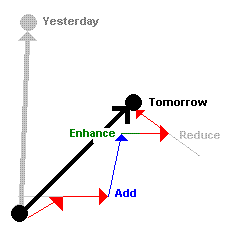
Transition to Vision
As you move to the new vision, you will use existing capabilities (red), reduce existing capabilities (gray), enhance existing capabilities (green), and add capabilities and processes through projects.
Moving your product to a new market, or extending your existing market would require the same kinds of efforts. Your product is a vector.
In the past few weeks, there has been a lot of discussion about fast followers, the lost of differentiation and price premiums, and commoditization. When your customers will no longer pay for additional capabilities you’ve incorporated into your product, you have been commoditized. Some customers may continue to pay, but never use those additional capabilities. In this case, your customers are overserved, and you can find yourself being attacked by a new entrant with a product based on a new technology. That entrant might not meet your performance threasholds, because they compete on other drivers. All of this involves messing with our vectors.
Commoditization forces you to find new drivers, new vectors of differentiation.
Fighting a fast follower depends on proprietary technologies or slight of hand.

Routes to a Feature
A feature can be created quickly (red). It will be thin. It might involve adding a dialog, a button or menu option, a column or two to your database tables, and a few computations. The same feature can be create richly (blue). You do this to explore future opportunites, and to build things that don’t show up in the interface, or in the reverse engineering efforts to capture behavior. If SaaS does anything for us, it removes executable code from the hands of our competitors, so reverse engineering is about what is seen under testing at the interfaces. You might not expose the APIs for some of the depth you’ve created in your rich project. Expose just enough to make it look quick. Then, when the fast follower releases their catch up, you release the next layer to exposure.
That exploration might increase the conceptual surface area or create a much richer conceptual geography for later exploitation. Let them follow. You can keep on rolling out premium. Maybe you’ll teach them to slow down, or look deeper. “Now eating time at the lunch counter.”
You could also take a vector view of your team. You could use those n-dimensional charts in Excel to map our the abilities of your team members, their estimation factors, your influence with each of them, and your communications effectiveness with each of them. You could then add their morpheme views together to form words if you will, which add up the vectors to a team score or vector.
That might be a bit much, but much is possible with a good representation of the problem of shipping on time and hitting your P&L numbers.
Getting distance from the details grants economic indifference. The big vector doesn’t care, but the comprising vectors determine the success of the big vector.
And, for all those product managers who want the stick, instead of the hard work of building influence, one last vector veiw.
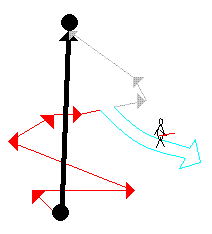
The Stick and the Goal
When hit with a stick, the capability leaves with some portion of your gantt chart. Congrats! Forget the stick.


